Pipeline Conversion Rate: You Don't Have a Lead Generation Problem
What pipeline conversion rate is, how to measure it in your CRM, what a good rate looks like – and the frozen zone of stalled deals where your cheapest revenue is hiding.
By Ilia Markov, B2B SaaS Growth Leader & Advisor
Before you spend another euro on lead generation, run one query in your CRM: every opportunity at stage 2 or later with zero logged activity in the last 90 days. Add up the value of what comes back.
That number is your frozen zone – and for most B2B companies with long sales cycles, it's bigger than anything a new lead campaign will produce this year. This guide covers what pipeline conversion rate is, how to measure it properly, what a good rate looks like, and why the fastest way to improve it has nothing to do with generating more leads.
What is pipeline conversion rate?
Pipeline conversion rate is the percentage of opportunities in your sales pipeline that become closed-won deals.
The basic formula:
Pipeline conversion rate = (closed-won deals ÷ total opportunities) × 100
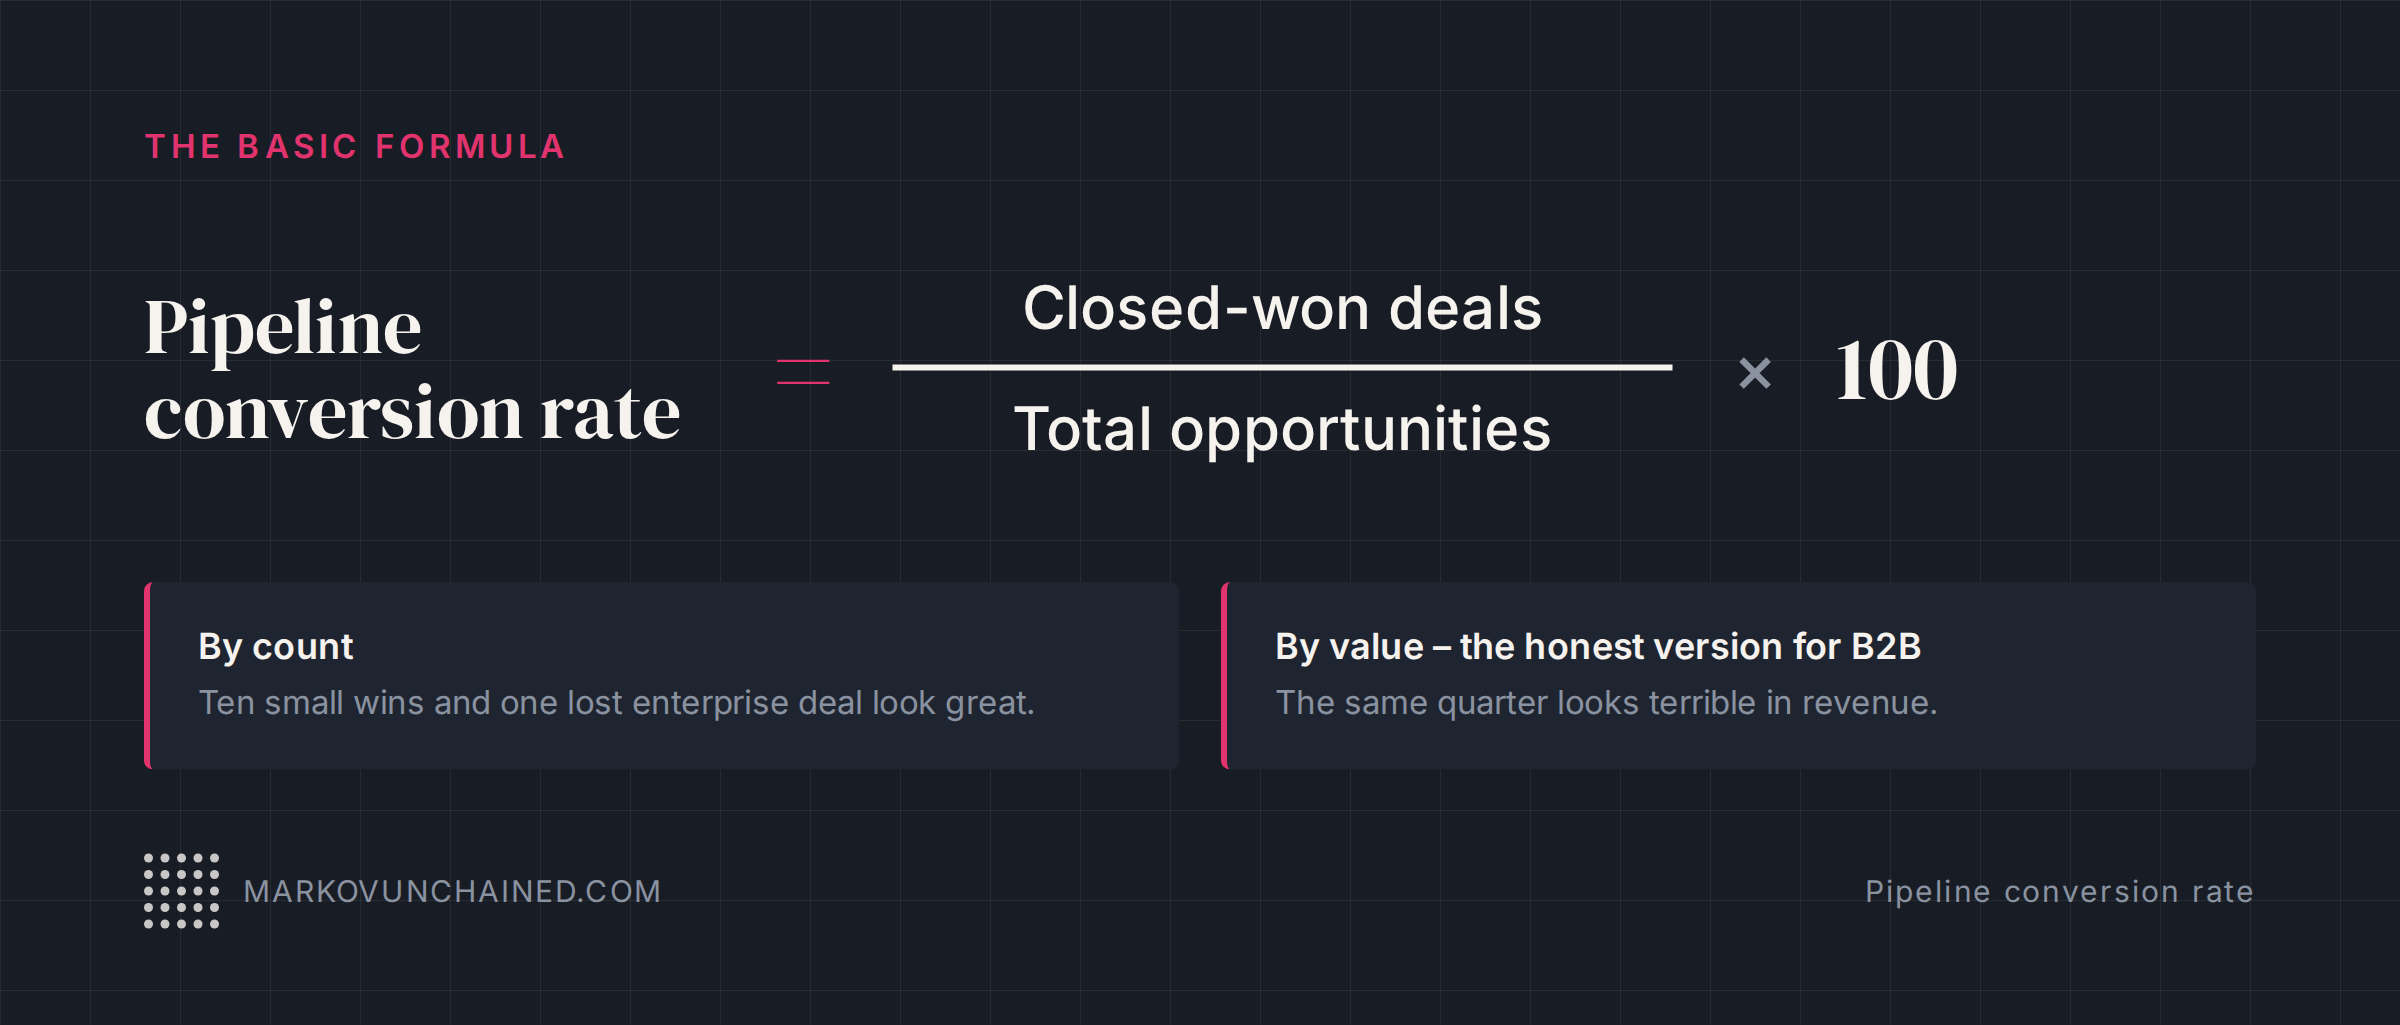
You can calculate it by deal count or by value. Value is usually the more honest version for B2B – ten small wins and one lost enterprise deal look great by count and terrible in revenue.
A working example: an industrial B2B client I advise set its annual goal at 5M signed from a 50M pipeline – a 10% conversion target by value, on deals worth half a million to a million each and 18-24-month sales cycles. Everyone in the company was asking for more leads. Then their Head of Sales summed up the quarter:
Currently, it's exploding. Have opportunities coming in. Still have not signed. So leads are there. Conversion is shit.
That describes more pipelines than most teams would admit.
Is pipeline conversion rate the same as win rate?
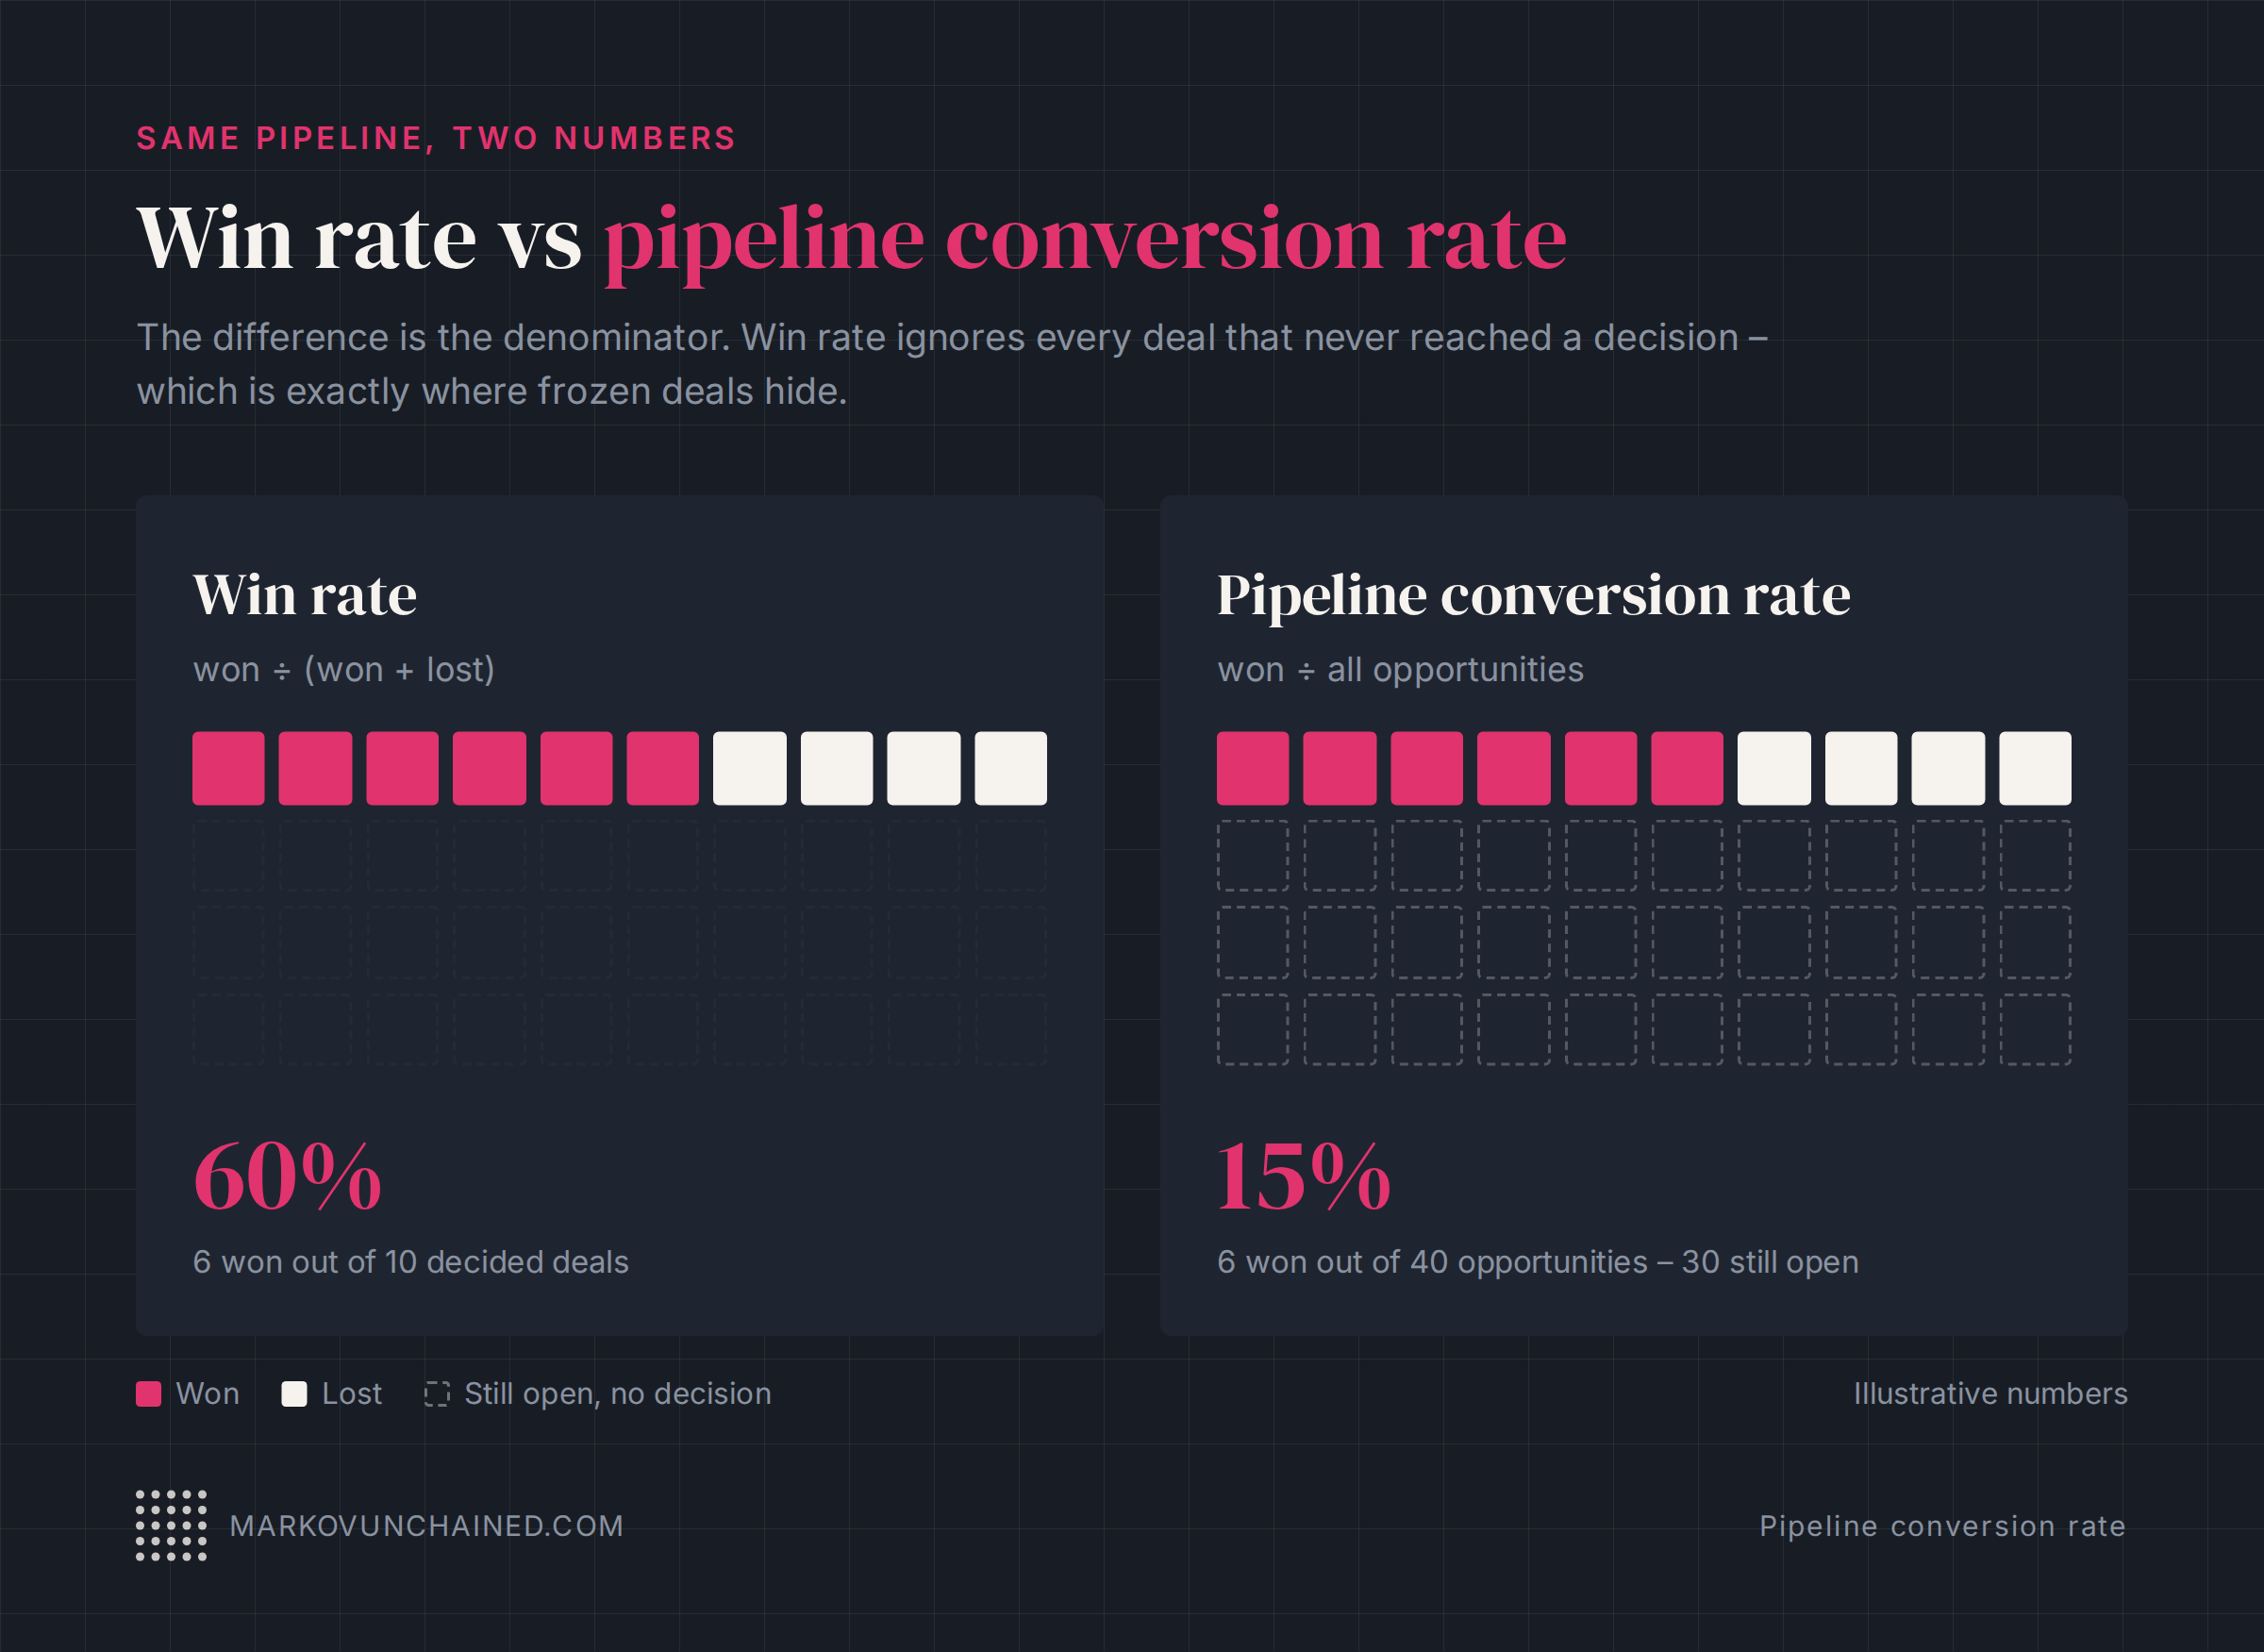
No. Win rate usually counts only deals that reached a decision: won ÷ (won + lost). Pipeline conversion rate counts every opportunity that entered the pipeline, including the ones still open. The gap between the two is the interesting part – a team can show a healthy win rate while half its pipeline never reaches a decision at all.
How do you measure it in your CRM?
The single overall number hides everything useful. Measure conversion stage to stage instead: what percentage of deals move from qualification to proposal, from proposal to negotiation, from negotiation to close. The stage where the percentage collapses is where your problem lives – and it's rarely at the top.
Three things to get right before you trust the numbers:
- Defined stages with entry criteria. If "qualified" means something different to each rep, your conversion rate is fiction. Write down what has to be true for a deal to enter each stage.
- Weighted vs unweighted pipeline. Decide which one you report and label it. A 50M unweighted pipeline and a 50M weighted pipeline are wildly different claims, and boards notice when the definition drifts.
- Activity logging that costs reps nothing. If tracking conversion requires salespeople to do extra admin, it will not happen. Ride on what they already log – calls, emails, meetings – and build the reporting on top. (More on this in a moment, because activity data is what makes the frozen zone visible at all.)
What is a good pipeline conversion rate?
Published benchmarks are mostly useless as targets and moderately useful as a sanity check.
The "average B2B close rate" figures you'll find quoted measure different things at different funnel stages, in different industries, with different definitions of "opportunity." A 10% pipeline-to-signed rate might be catastrophic for a transactional SaaS motion and unremarkable for million-dollar industrial deals on two-year cycles.
The benchmark that matters is your own trend, stage by stage, quarter over quarter. If proposal-to-close was 40% last year and it's 25% now, that's a real signal. If a benchmark report puts you three points below some industry average, that's noise.
Most teams track a pile of numbers precisely so that some of them can always show progress. Pick a small set – active pipeline, stage-to-stage conversion, average contract value, sales cycle length – and hold the trend against itself.
Why is your pipeline conversion rate low?
Usually because deals freeze, not because you lose them.
Deals in long-cycle B2B rarely die. Nobody sends the rejection email. They sit at stage 2 or 3 with no activity, no next step and no one accountable, while everyone's attention moves to the newer, shinier opportunities at the top of the funnel. Your conversion rate is low because a chunk of your denominator has quietly stopped moving, and nothing in your reporting says so.
At that same industrial client, the marketing lead's first move was to go through Salesforce and pull out the prospects that had gone untouched – five or six to start with, "just six out of god knows, maybe 20, 30," in his words. Not lost. Not disqualified. Frozen – and invisible in every report the board saw, because the reports counted pipeline value and lead volume, not motion.
The general rule: if it isn't in the CRM, it doesn't exist. Frozen deals are invisible because no activity means no data, and no data means no line on any dashboard. You have to query for the absence deliberately.
Why do deals freeze? Almost always some version of the same gap:
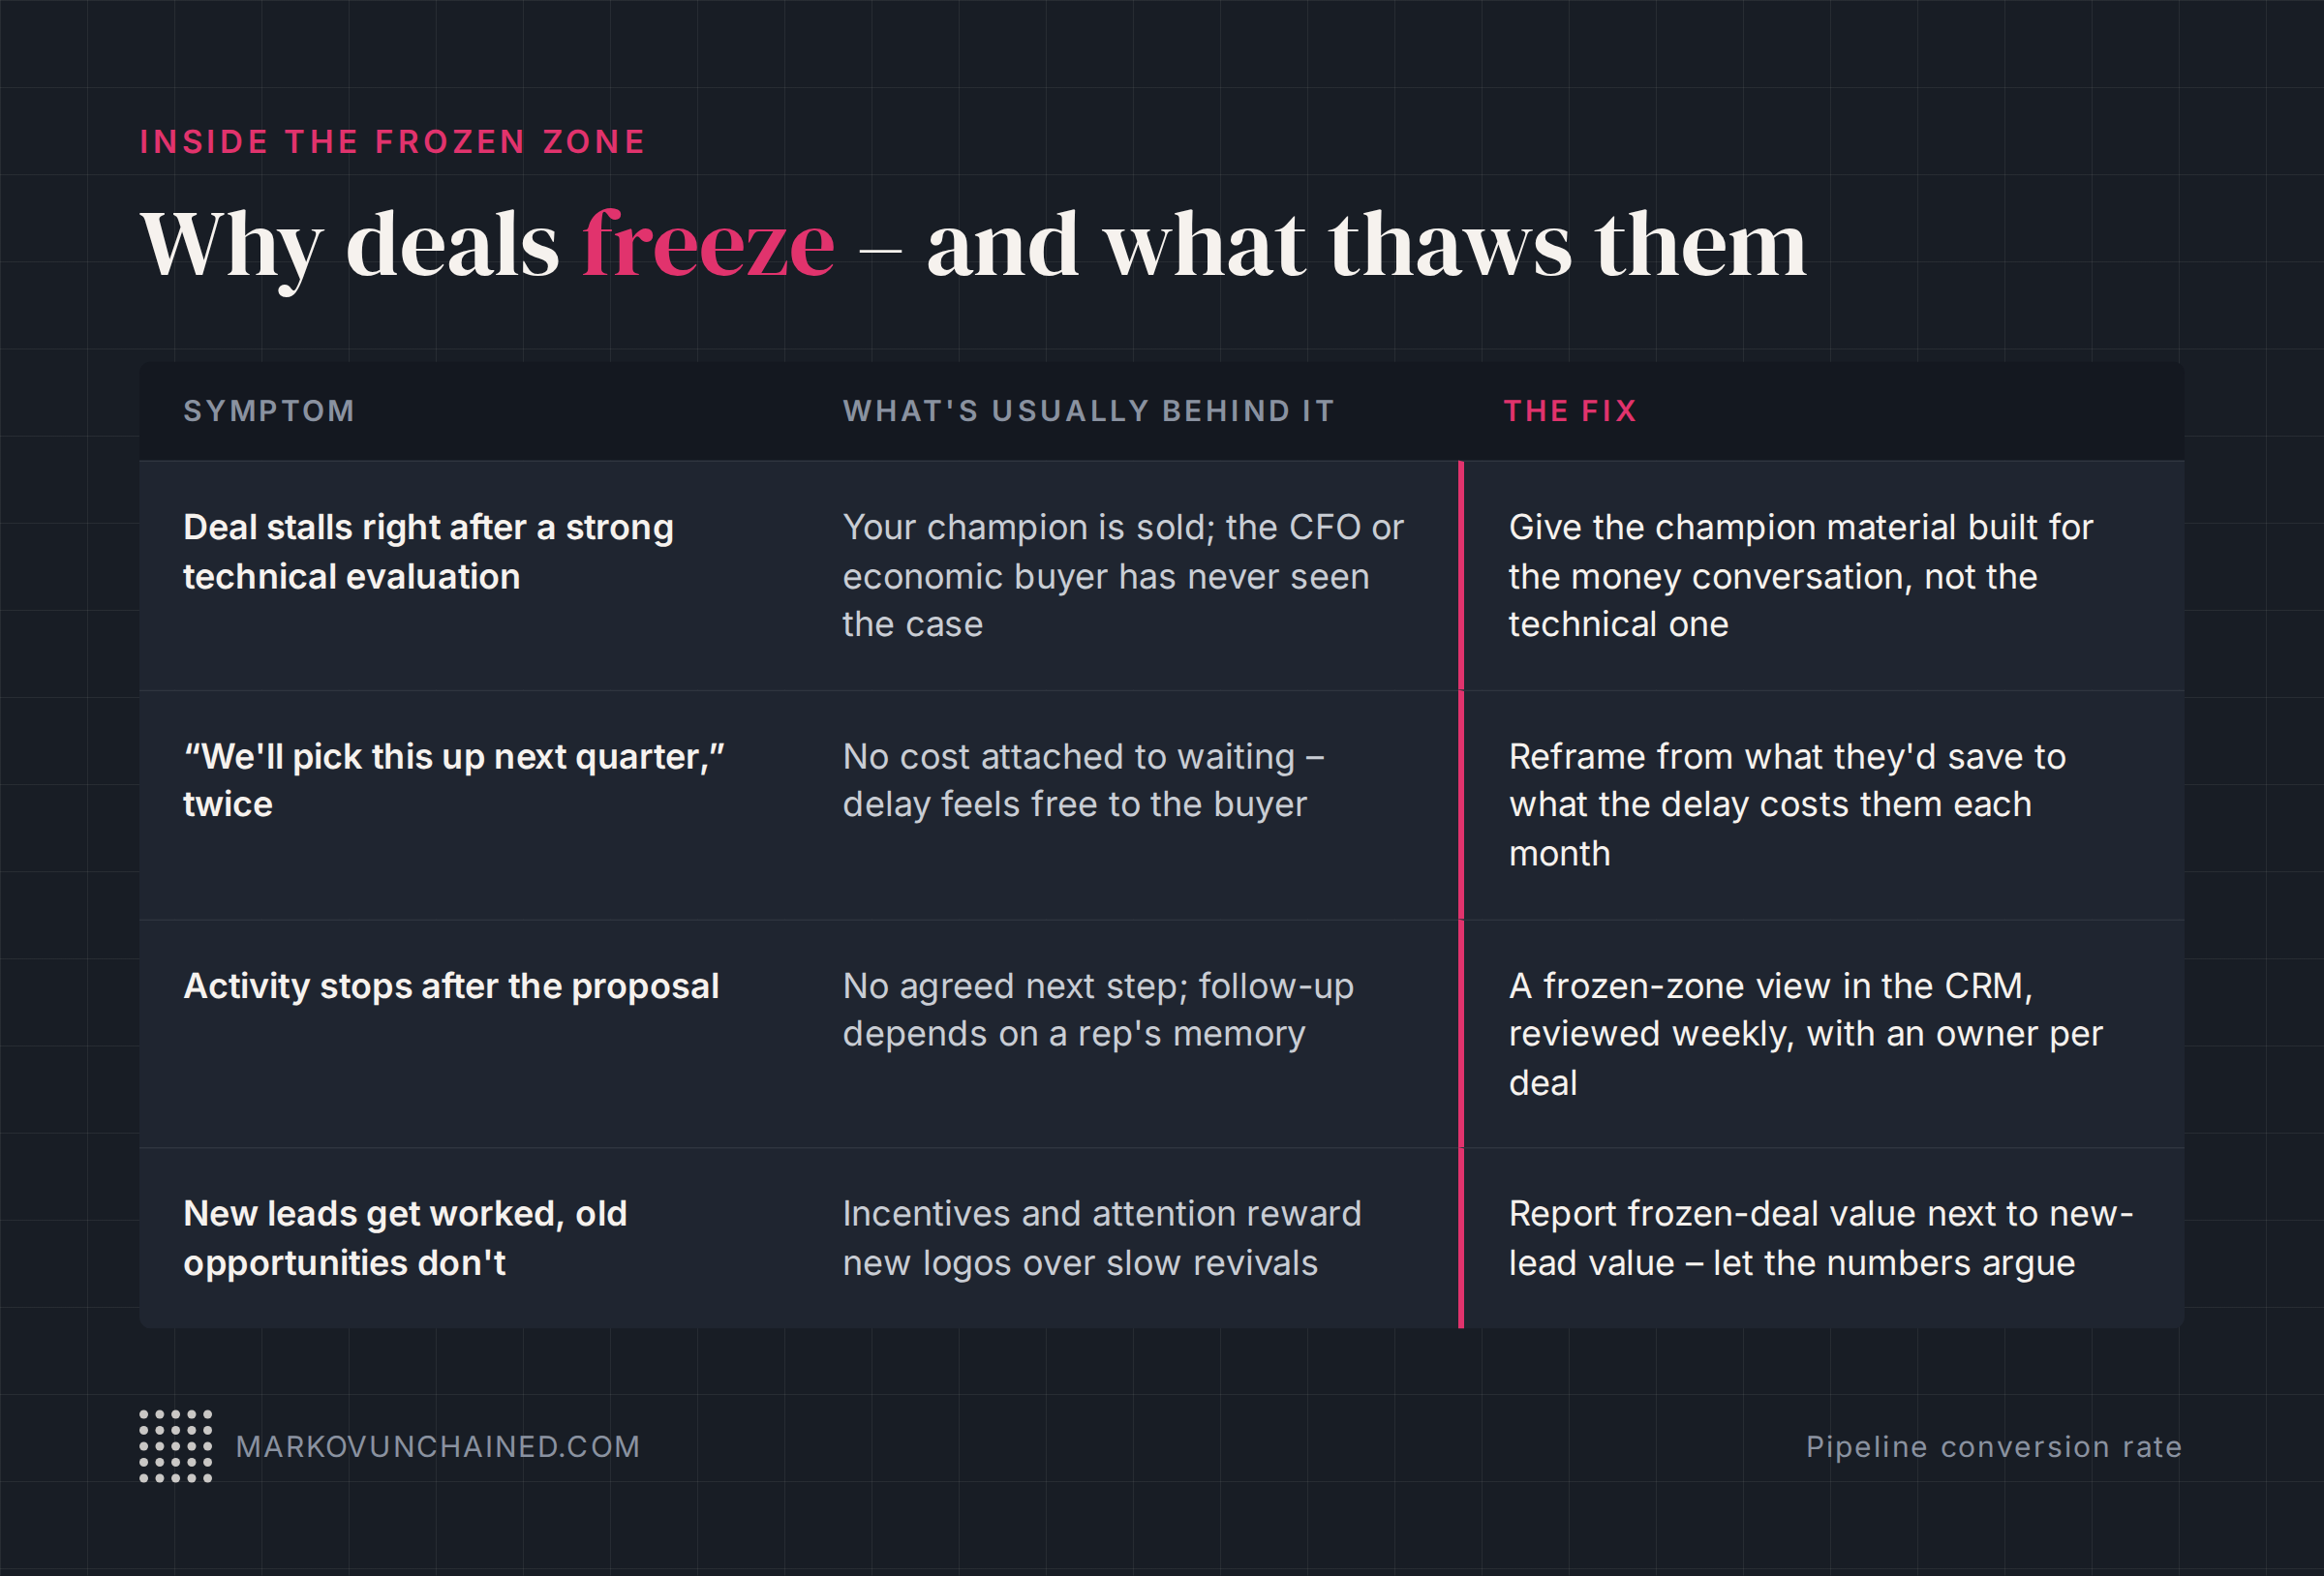
| Symptom | What's usually behind it | The fix |
|---|---|---|
| Deal stalls right after a strong technical evaluation | Your champion is sold; the CFO or economic buyer has never seen the case | Give the champion material built for the money conversation, not the technical one |
| "We'll pick this up next quarter," twice | No cost attached to waiting – delay feels free to the buyer | Reframe from what they'd save to what the delay costs them each month |
| Activity stops after the proposal | No agreed next step; follow-up depends on a rep's memory | A frozen-zone view in the CRM, reviewed weekly, with an owner per deal |
| New leads get worked, old opportunities don't | Incentives and attention reward new logos over slow revivals | Report frozen-deal value next to new-lead value – let the numbers argue |
Notice what's missing from that table: closing techniques. A frozen pipeline is mostly a visibility and messaging problem, which makes it – uncomfortably for some sales teams, usefully for you – a problem marketing can work on.
How do you unfreeze a stalled pipeline?
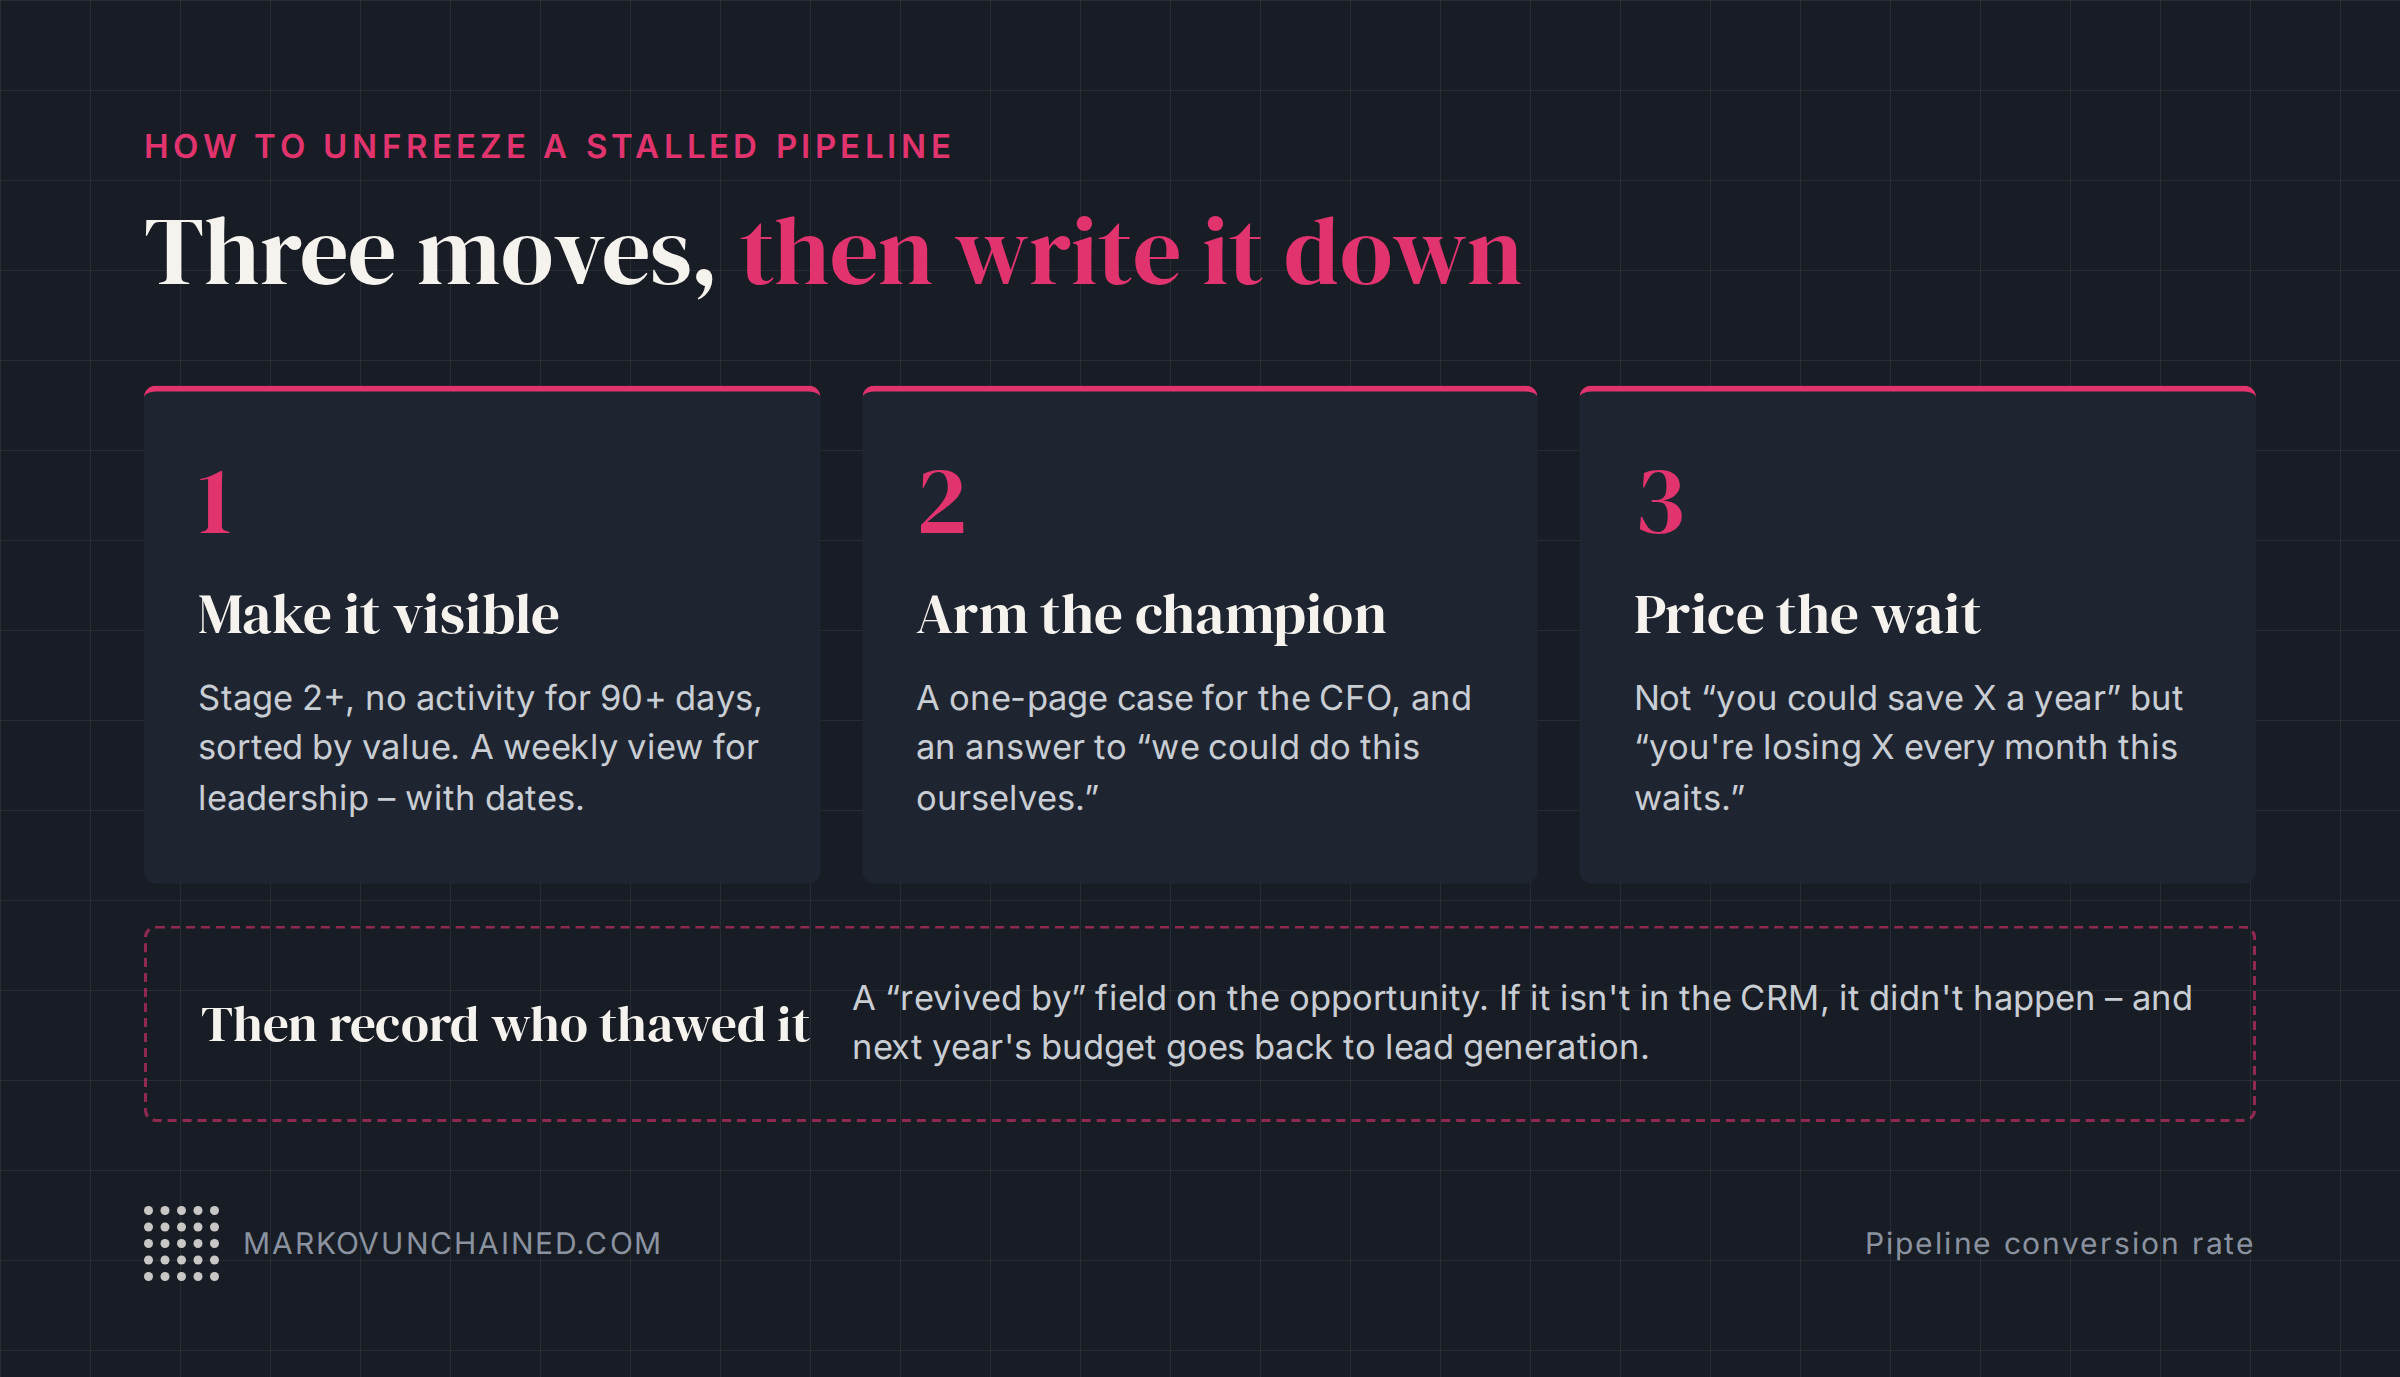
Make the stalled deals visible, give the champion the CFO's version of the case, and put a price on waiting.
1. Make it visible
Run the query: stage 2+, no activity for 90+ days, sorted by value. Put the result in a view that leadership sees weekly, with dates. A list of company names next to "last activity: March" creates more urgency in one board meeting than a quarter of pipeline commentary.
2. Arm the champion
The person who loves your product is usually not the person who signs. Deals freeze in the space between them. Build the two assets that bridge it: a one-page case for the CFO (what this costs, what it returns, what happens if we do nothing) and an answer to "we could do this ourselves" (what internal delivery costs when you count the people). Your champion has been improvising these arguments in meetings you'll never attend. Stop making them improvise.
3. Reframe the cost of waiting
"You could save X per year" produces polite nods. "You're losing X every month this decision waits" produces meetings. Same math, different frame – loss moves economic buyers in a way savings don't. The strongest version lets the prospect do it to themselves: a simple calculator where they plug in their own numbers and watch the monthly cost of delay appear. They can't argue with their own inputs.
Then record who thawed it
When one of those deals moves, log why – a "revived by" field on the opportunity, or a campaign attached to it. Otherwise the thaw gets credited to the rep who happened to send the last email, marketing's CFO one-pager is recorded nowhere, and next year's budget goes back to lead generation. Same rule as above: if it isn't in the CRM, it didn't happen.
When is more lead generation the right answer?
Two honest exceptions. If your pipeline is young – a new company, a new segment, fewer than a couple of dozen real opportunities – there's nothing to unfreeze yet, and top of funnel is the work. And if stage-to-stage conversion is healthy but volume is thin, the machine works and needs feeding.
For everyone else, check the frozen zone first. It's the cheapest revenue you have, because you've already paid to acquire every deal sitting in it.
What should you do on Monday?
- Run the frozen-zone query: stage 2+, 90+ days without activity, sorted by value.
- Add up that value and put it next to your quarterly new-lead target. Sit with the comparison.
- Pick the three most valuable frozen deals and ask one question per deal: who is the economic buyer, and what have they personally seen?
- Build the CFO one-pager for the most common objection across those deals.
- Set up the frozen-zone view as a weekly report with an owner per deal – and a field that records what revived it.
None of this is glamorous, and none of it thaws a pipeline overnight – deals that froze over months don't reopen in a week, and some frozen deals are dead deals wearing a coat. But every hour spent here works on revenue you've already paid for, which is more than most lead generation can claim.
If you ran the query and the number scared you, I'm happy to look at it with you – setting up this kind of pipeline visibility is a big part of what I do with B2B SaaS founders and their first marketers. Book a call and bring the number.