The ICE Framework: How to Score Growth Experiments – and When Not To
What the ICE framework is, how to make ICE scores objective, ICE vs RICE – and what founders without a marketer should run instead.
By Ilia Markov, B2B SaaS Growth Leader & Advisor
ICE is the most popular way to rank growth experiments. Score every idea on Impact, Confidence and Ease, sort the list, run whatever's on top. It's fast and simple, and for most founders without a marketer it's the wrong tool for the next six months.
The math is fine. The problem is that ICE assumes three things you probably don't have yet: a long list of ideas, people to ship them, and enough data to score confidence honestly. This guide covers how ICE works, the scoring details that decide whether it helps or quietly picks the easiest idea every time, and how it compares to RICE. Then it covers what to run instead until you have the scale ICE was built for.
What is the ICE framework?
ICE is a scoring method that ranks experiment ideas on three scores: Impact, Confidence and Ease.
Sean Ellis, founder of GrowthHackers, described it in a 2016 SaaStr talk. Each idea answers three questions:
- Impact: if this works, does it change the course of the business?
- Confidence: how much data do you have that it will work?
- Ease: how easy is it to build and test?
Each one is scored "on a scale of 1 to 10, 10 being something that's really good," and the highest combined score goes first.
One more line from the same talk matters for everything below: "The goal of the growth team is to test at a high tempo." ICE was built for a team that ships experiments every week and needs a quick way to pick the next one. Keep that in mind.
How do you calculate an ICE score?
The textbook version: score each dimension from 1 to 10 and multiply them (multiplying, rather than averaging, lets one weak score pull an idea down). Highest score wins.
That version breaks fast. Three 1–10 scores filled in from memory give you a ranking that looks precise and mostly reflects whoever filled it in. Three details decide whether ICE is worth using.
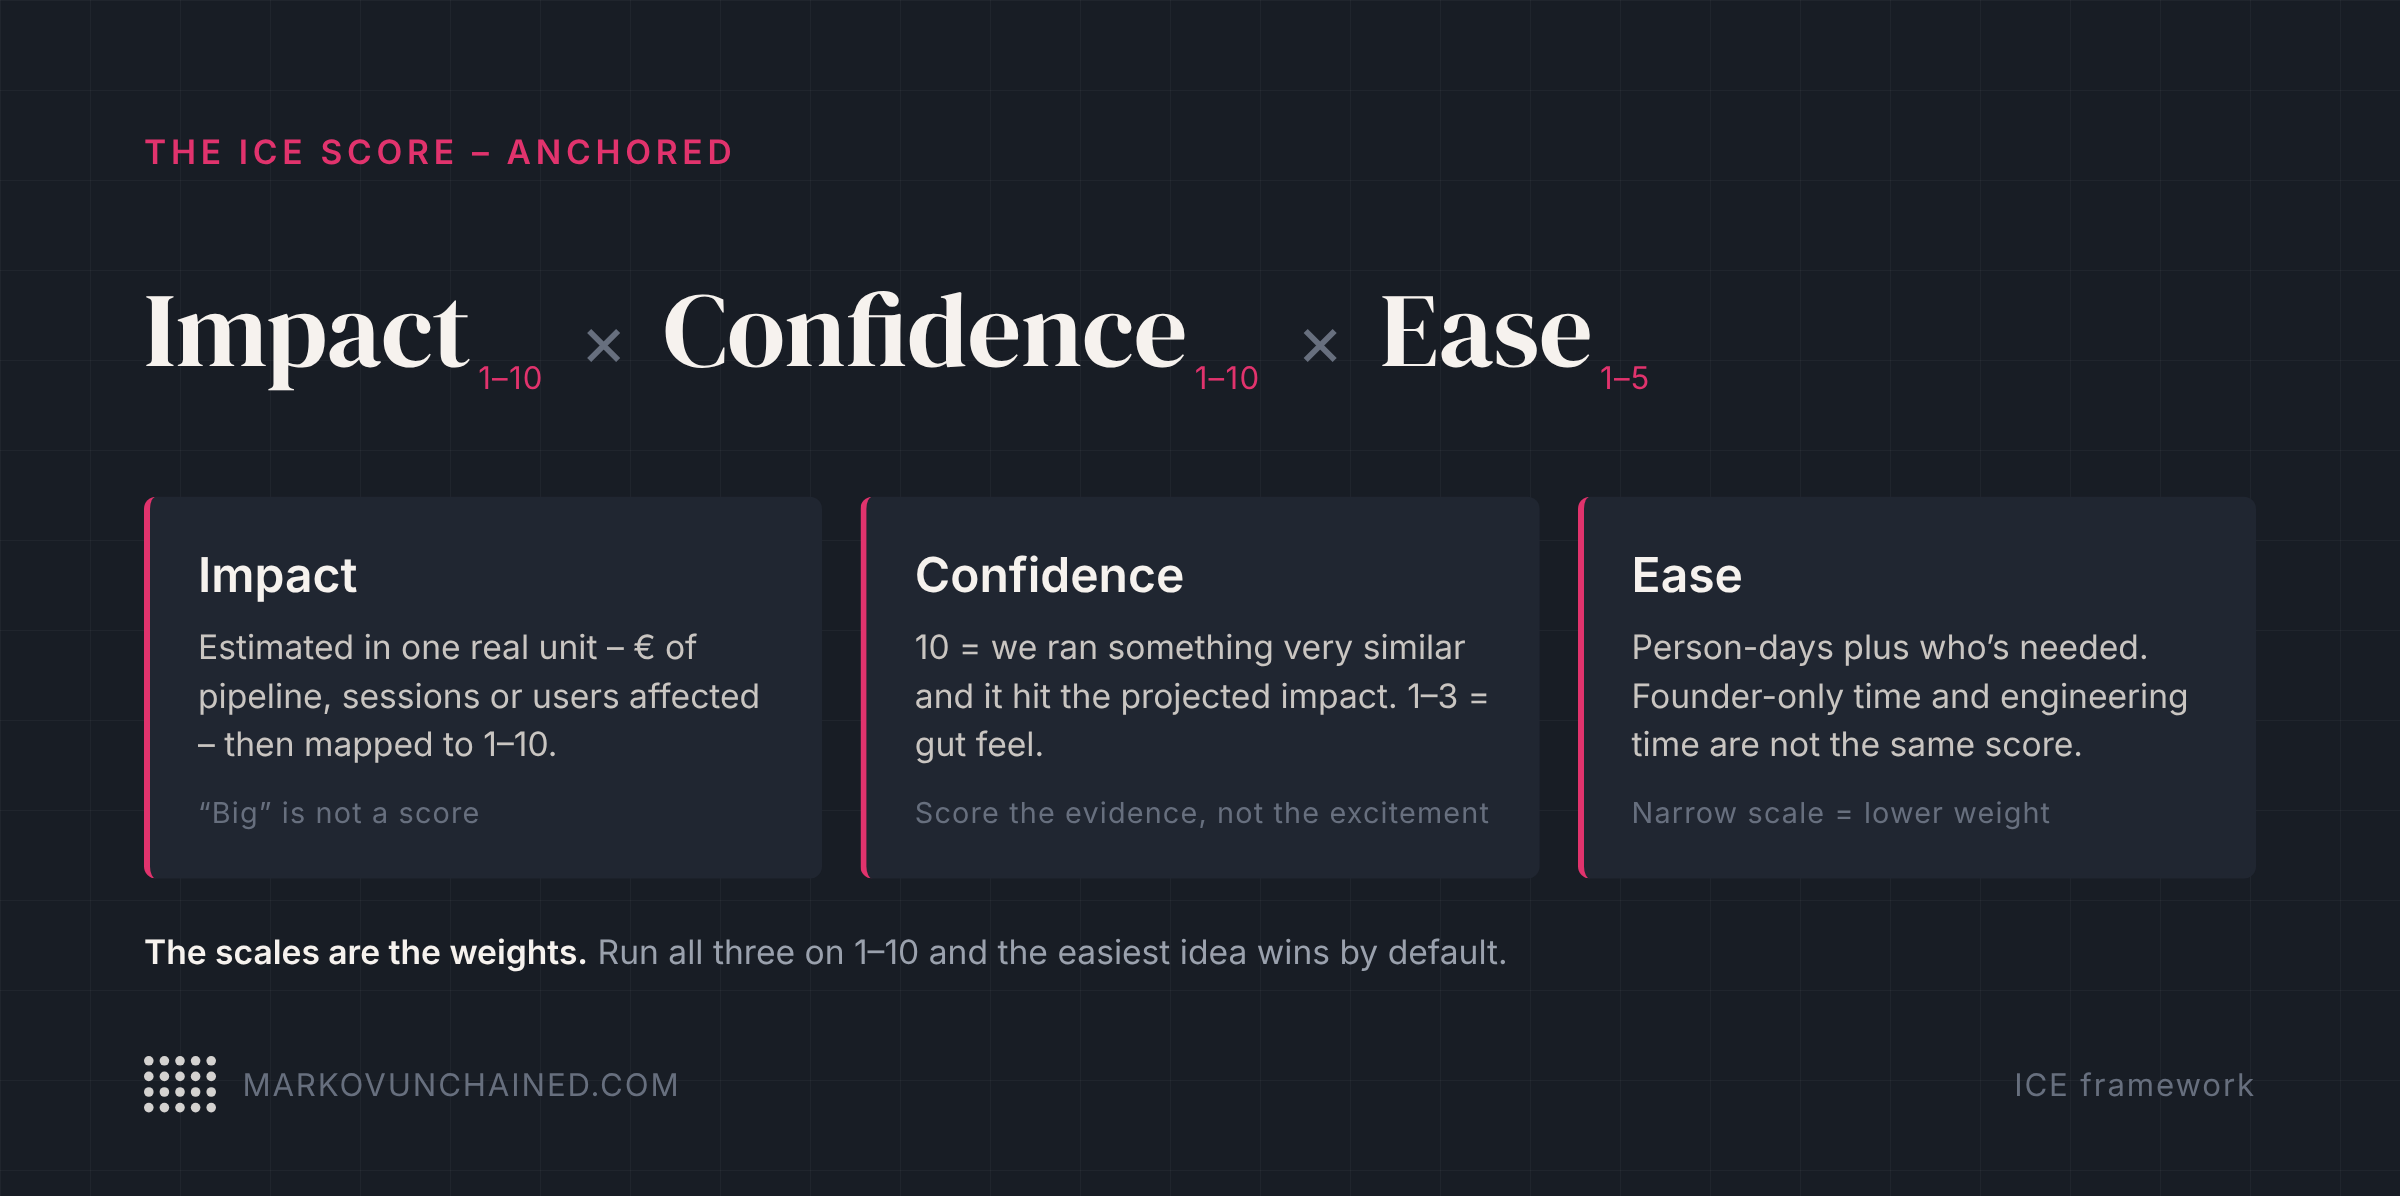
1. Measure Impact in a real unit. "Big" isn't a score. Pick the one unit that matches this quarter's goal – $ of new pipeline, sessions, or users affected – estimate it for every idea, then map the ranges to 1–10. If +€50k of new ARR a quarter is a 10 and +€5k is a 4, two people scoring the same idea land in the same place.
2. Anchor every scale. Write down what each number means before anyone scores. For Confidence, score the evidence, not the excitement:
- 10: we ran something very similar and it hit the impact we projected
- 9: we ran something very similar and it came close
- 7–8: our own qualitative signal – customer calls, sales objections, replies
- 4–6: a competitor does it, or it worked somewhere comparable
- 1–3: gut feel
Do the same for Ease, in person-days plus who's needed. Three days of the founder's time and three days waiting in the engineering queue are not the same score.
3. Use different scales on purpose. If all three dimensions run 1–10, Ease carries as much weight as Impact, and a cheap idea with no evidence beats an expensive one you're sure about. Easy things always get prioritized. The fix is to make the scales your weights: score Ease from 1 to 5 so it can't decide the list on its own, or stretch Confidence to 1–20 in a quarter where you can't afford to miss.
RICE, covered below, does a version of the same thing with fixed percentages for Confidence. Both force you to write down why you believe something before you rank it.
What does an ICE scoring example look like?
A hypothetical B2B SaaS company: around €2M ARR, a founder handling marketing, four engineers. Five ideas – three marketing experiments the founder could run alone, two that need engineering.
Scored the textbook way – 1–10 everywhere, from gut feel:
| Idea | Lane | Impact | Confidence | Ease | ICE |
|---|---|---|---|---|---|
| Comparison pages vs the top 3 competitors | Marketing | 7 | 6 | 6 | 252 |
| Homepage rewritten around one ICP | Marketing | 6 | 5 | 8 | 240 |
| In-app checklist that leads trial users to the paid feature | Build | 8 | 6 | 3 | 144 |
| Founder posting on LinkedIn 3x a week | Marketing | 5 | 4 | 7 | 140 |
| Switch the free trial to a reverse trial | Build | 8 | 5 | 2 | 80 |
Marketing takes the top two spots and the reverse trial comes last. Now the same five ideas with the three fixes: Impact estimated in new ARR per quarter, Confidence on the evidence ladder, Ease on 1–5.
| Idea | Lane | Expected impact | Impact | Confidence | Ease (1–5) | ICE |
|---|---|---|---|---|---|---|
| Switch the free trial to a reverse trial | Build | ~€40k ARR | 9 | 9 | 2 | 162 |
| In-app checklist that leads trial users to the paid feature | Build | ~€30k ARR | 8 | 8 | 2 | 128 |
| Comparison pages vs the top 3 competitors | Marketing | ~€15k ARR | 6 | 6 | 3 | 108 |
| Homepage rewritten around one ICP | Marketing | ~€10k ARR | 5 | 5 | 4 | 100 |
| Founder posting on LinkedIn 3x a week | Marketing | ~€5k ARR | 4 | 3 | 5 | 60 |
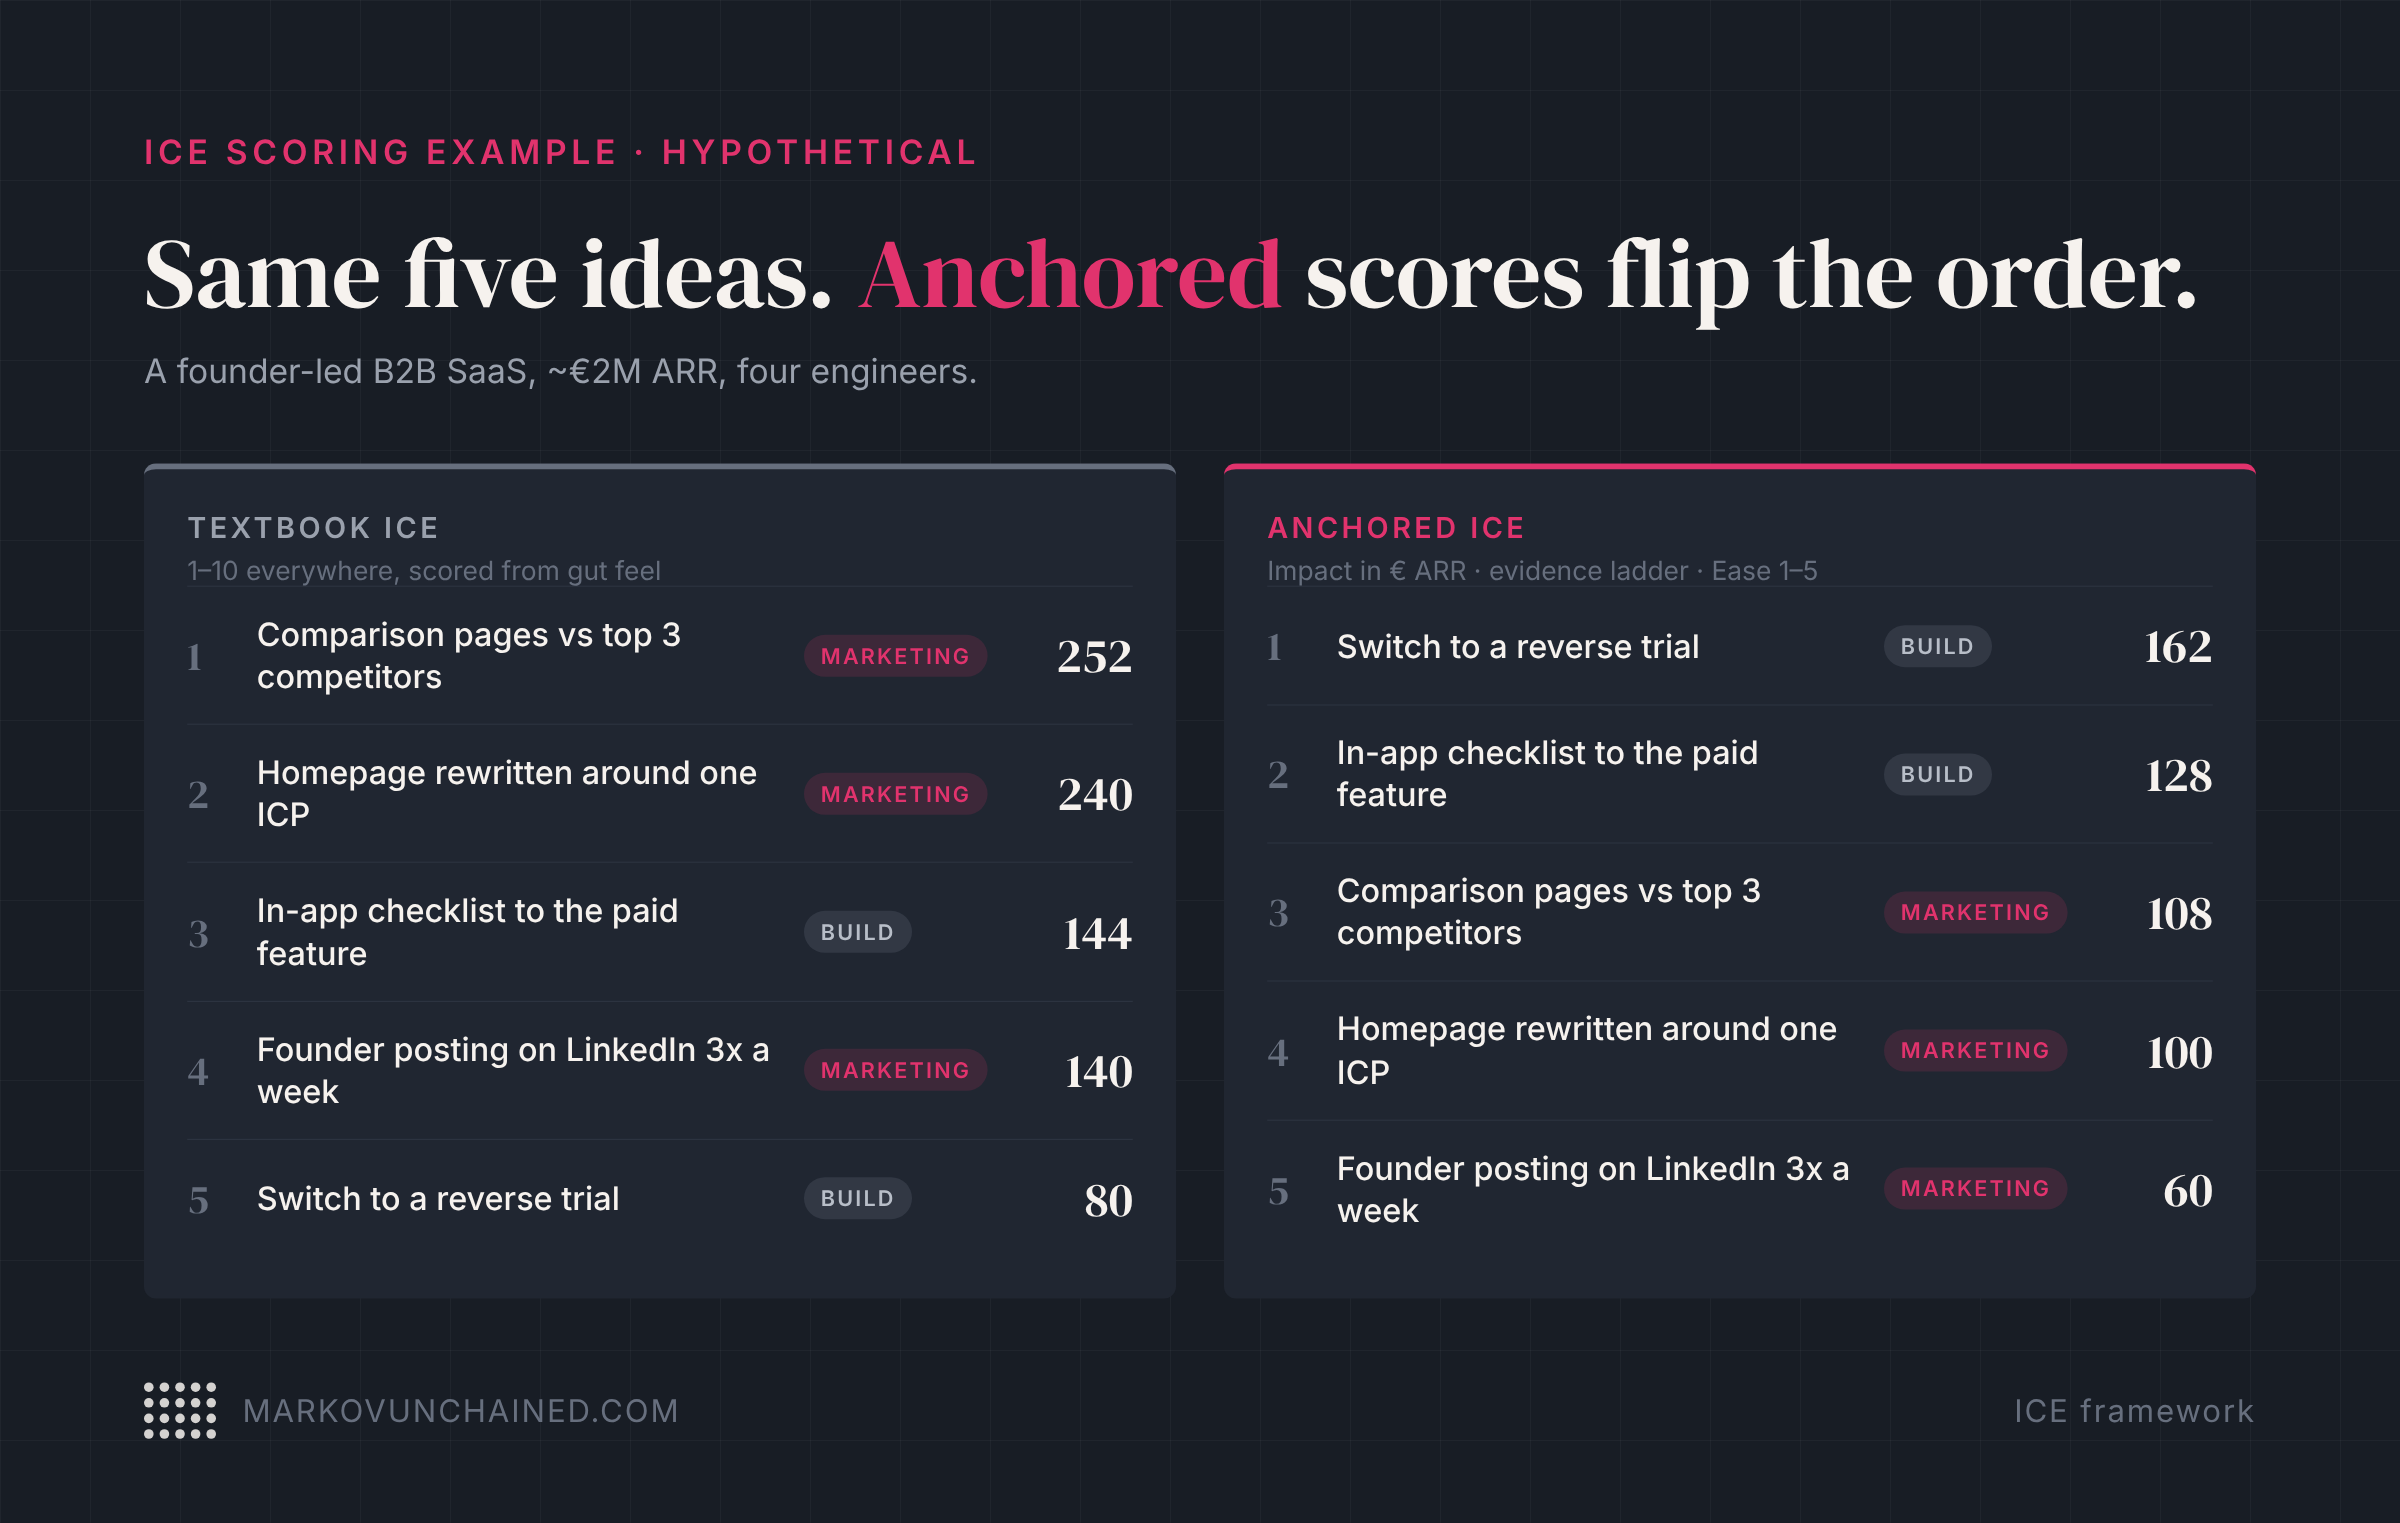
The order flips. The reverse trial goes from last to first, because its Confidence is no longer a guess: in my experience, a reverse trial beat every other trial model I've tested on paying accounts, and that's a 9 on the ladder. The checklist rises because, in this example, trial users keep asking support how to reach the paid feature – a real qualitative signal. LinkedIn drops to last because "the founder should post more" scores a 3 once you have to name the evidence.
That's the version of ICE worth using. Notice what it still doesn't tell you: whether anyone can build the top two this quarter. Hold that thought.
ICE vs RICE: which should you use?
Both rank ideas by expected value against cost. They differ in who they were built for.
| Framework | What you score | Best for |
|---|---|---|
| ICE | Impact × Confidence × Ease | Growth teams running many small experiments a week |
| RICE | Reach × Impact × Confidence ÷ Effort | Product teams with usage data and a roadmap to fight over |
RICE came out of Intercom. Sean McBride published it in 2018 after the team couldn't find a system that compared ideas consistently. It adds Reach (how many people an idea touches in a set period) and swaps Ease for Effort in person-months. It also fixes the scales: Impact is 3, 2, 1, 0.5 or 0.25, and Confidence is 100%, 80% or 50%. Anything below 50% is, in Intercom's words, a "total moonshot."
The verdict: if you have product usage data and you're prioritizing features, use RICE. If you have a growth team shipping experiments every week, use ICE with anchored scales. If you have neither, keep reading.
What are the weaknesses of ICE?
Three: scores that come from a hunch, a built-in pull toward easy ideas, and no idea what your team can ship. The fixes above handle the first two. Nothing in the formula fixes the third.
Anchoring makes scores repeatable, but it doesn't remove judgment, and the person scoring is usually the person who had the idea. Weighted scales slow down the bias toward easy ideas, but a team that sorts by ICE for a quarter still drifts toward small, safe bets. A scoring model is a compass, not an itinerary – and a quarter spent only on quick wins leaves you exactly where you started.
Capacity is the weakness that kills ICE in practice.
Why does ICE break before you have scale?
We tried ICE scoring at a mature SaaS company I worked at, and it didn't stick. Engineering work moved slower than our experiment list, so none of the high-impact experiments we wanted to run could move. What shipped, week after week, were the quick wins – which made the whole scoring effort irrelevant. The ranking said one thing; capacity decided another.
That was a mature company with a real team. For a founder without a marketer, every assumption behind ICE is weaker:
- No tempo. Ellis talks about a weekly testing cadence once there's a large backlog of ideas. You are the backlog, the team and the testing cadence.
- No data for Confidence. Without your own numbers, almost every score lands at 1–3 or 4–6 on the ladder. The ranking is mostly noise with decimals.
- No list worth ranking. Ten ideas don't need a scoring model. You can hold them in your head and argue them out in 20 minutes.
- No one to align. ICE is as much an alignment tool as a ranking tool: it gives a team and its stakeholders one shared way to argue about priorities. A founder and one or two people rarely need that, although scoring a short list once can still clarify your own thinking.
Spend an afternoon scoring 40 rows and you'll have ranked your backlog more precisely than you can ever execute it. New tactics come from running the ordinary ones well, not from a better spreadsheet.
Should marketing and product experiments share one backlog?
No. Weighting fixes the ranking. It doesn't create engineering time.
In the anchored table, the two build ideas win. In real life, they then wait in the engineering queue behind the roadmap, while the marketing ideas the founder could ship this week sit below them, unstarted. Mix the two kinds in one list and you get one of two outcomes: marketing wins on Ease and the product-side bets never get picked, or the product-side bets win and nothing ships.
That's expensive either way, because the build side is where onboarding, pricing and trial-model changes live – the experiments that often move conversion the most.
Run two lanes instead:
- Marketing lane – ideas you or a marketer can ship without engineering. Rank them against each other.
- Build lane – ideas that need product or engineering. Rank them against each other, and agree the capacity once a quarter with whoever owns the roadmap.
Then take the top of each lane. Each lane moves at its own speed, and the build lane gets engineering time someone has already agreed to.
How do you balance quick experiments with long bets?
Run both at once, and judge the first 90 days on what you learned, not on the growth curve.
Quick experiments answer in weeks: targeted LinkedIn outreach to one segment, a €1–2k paid test, a homepage rewrite. Long bets take months to show anything: SEO and AI-search content, comparison pages, a partner or creator program.
Run only quick experiments and you never build anything that compounds. Run only long bets and you spend 90 days with nothing to show and nothing learned. For a founder-led team, two or three quick experiments plus one long bet is plenty.
Then change what counts as a good first quarter. Not "traffic doubled," but a working experiment roadmap: what you tested, what won, what you killed and why. A documented loss is progress. An undocumented win is luck you can't repeat.
Notice you don't need an ICE score to pick four things.
What should you run instead? A bet, a number, a kill switch
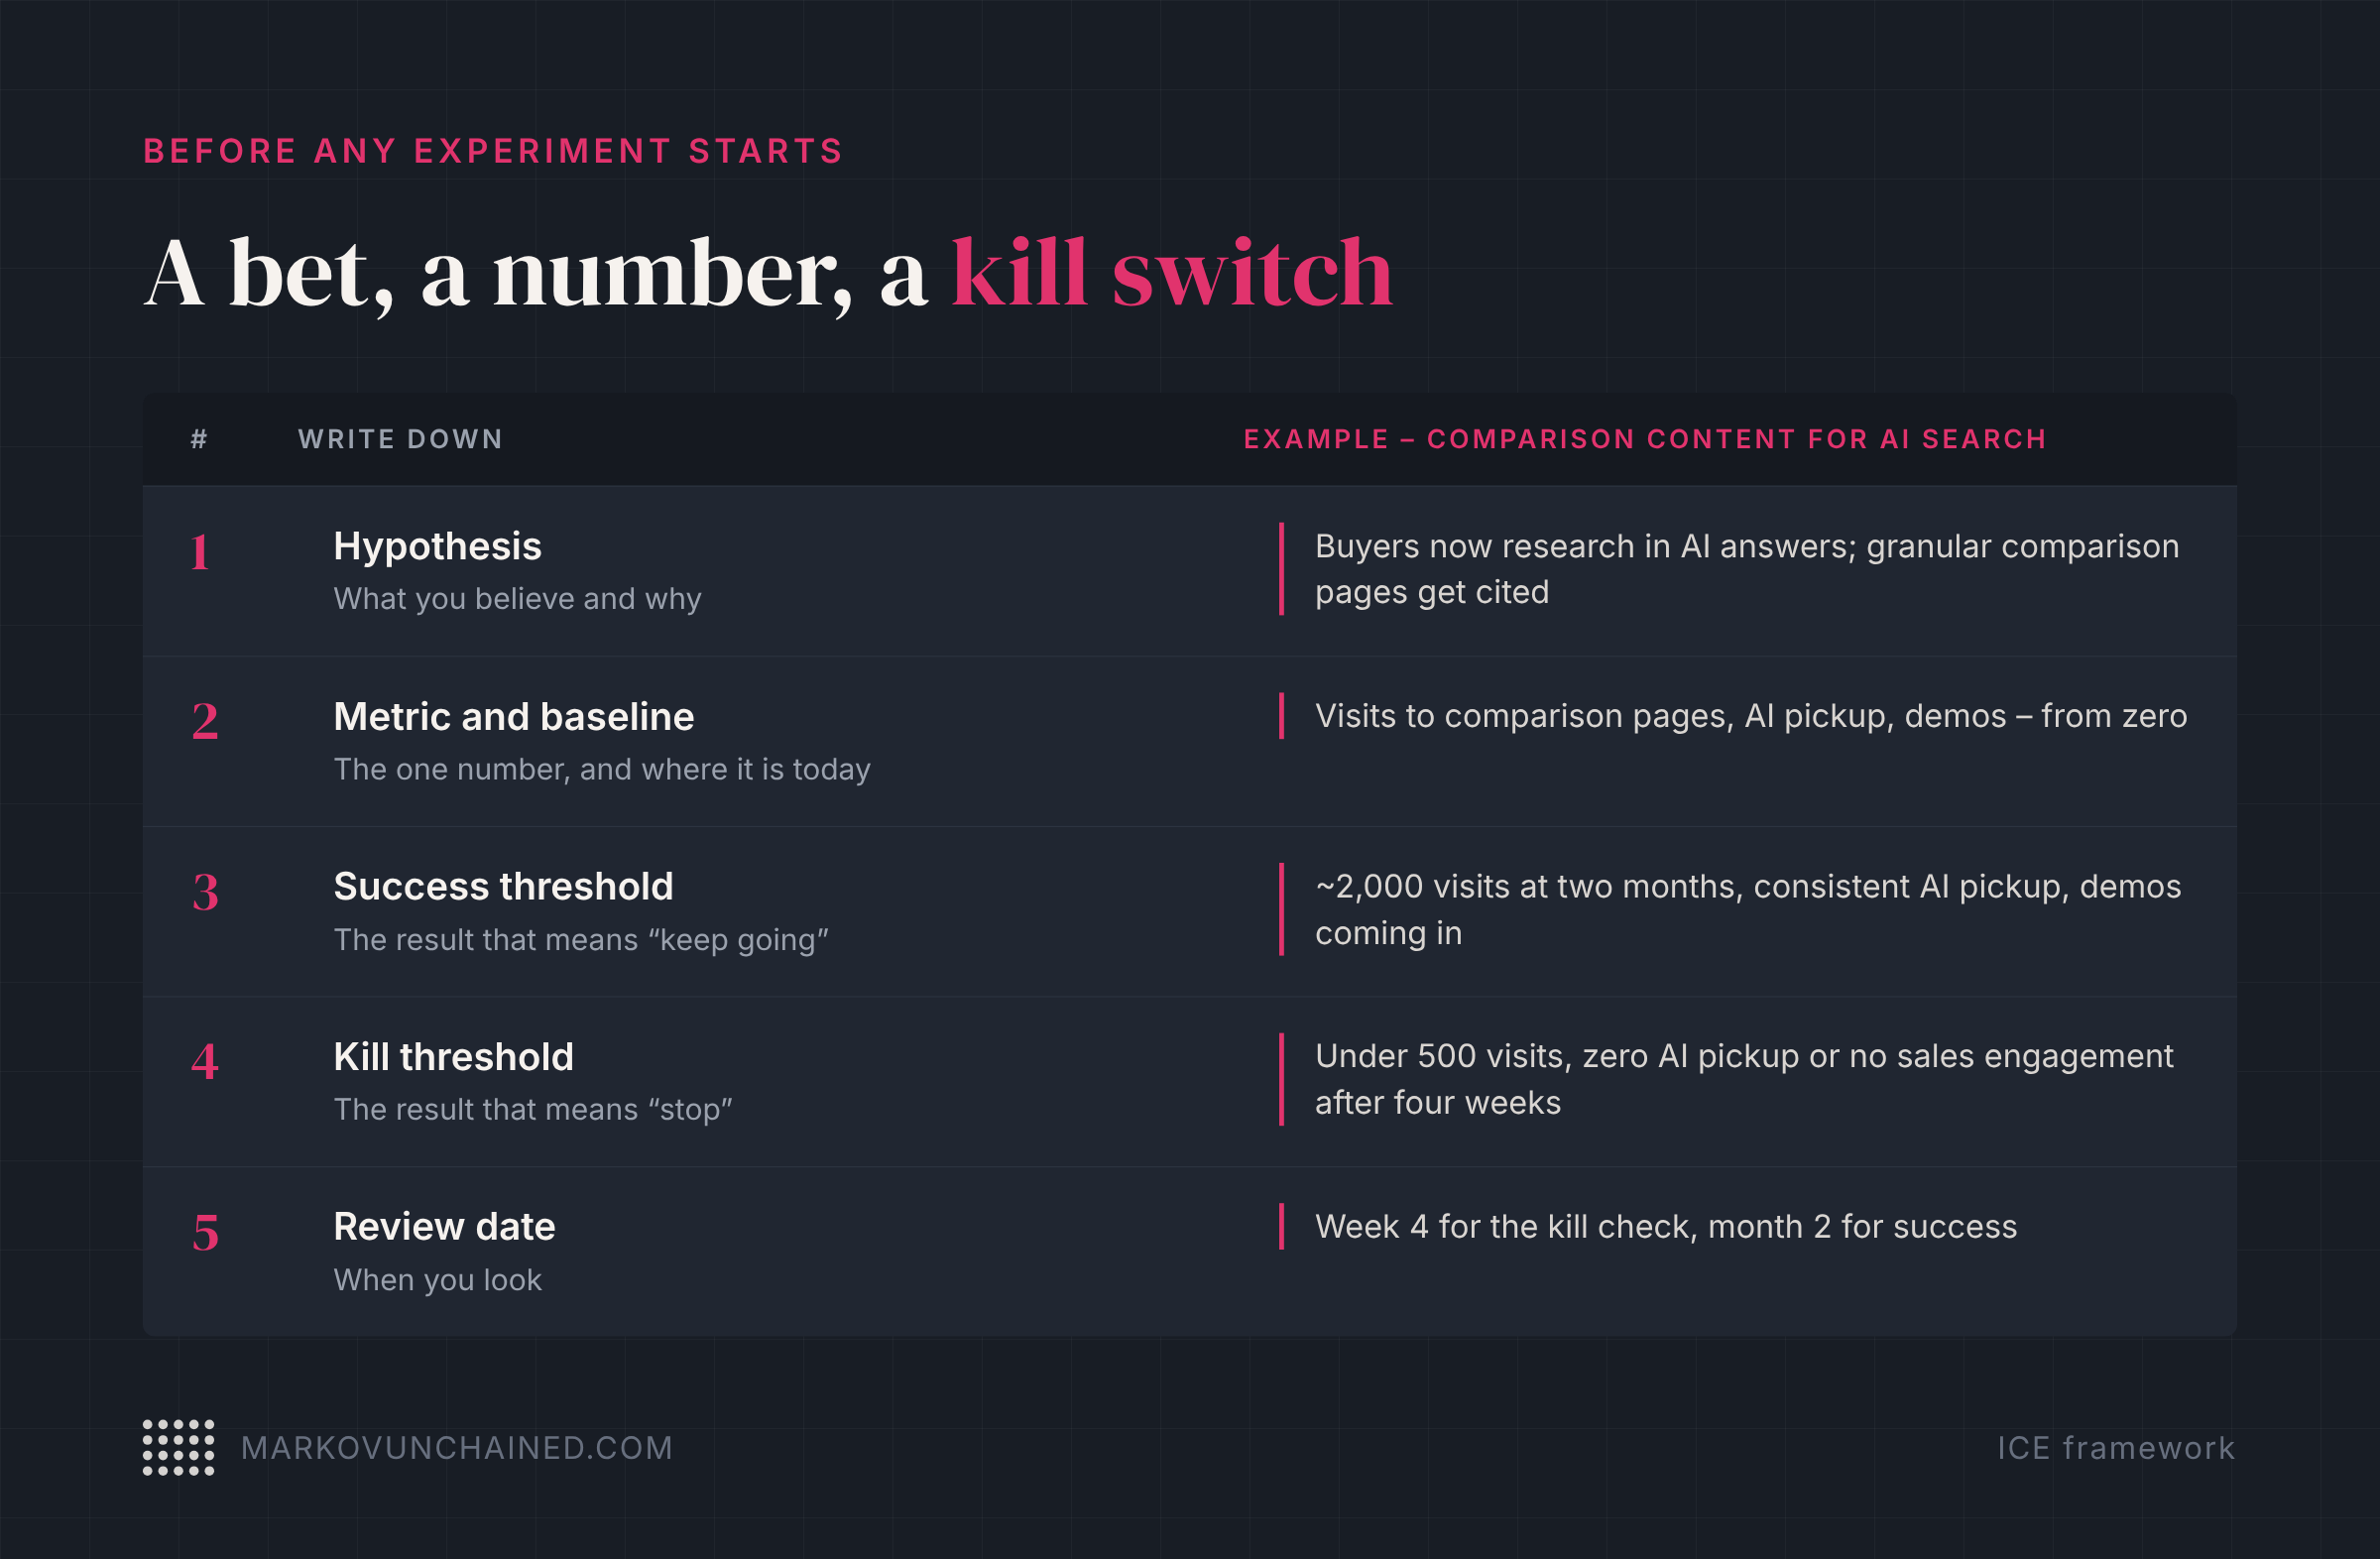
Write every experiment down in five lines before you start:
- Hypothesis – what you believe and why
- Metric and baseline – the one number it should move, and where that number is today
- Success threshold – the result that means "keep going"
- Kill threshold – the result that means "stop"
- Review date – when you look
Here's what that looked like in a growth plan I put together for another mature SaaS, this one with flat traffic. Three bets, ranked by argument rather than by score: comparison content built for AI search first, a competitor comparison tool for the sales team second, community partnerships third (the most resource-intensive, so last). The first bet had both numbers written down before any content existed:
- Success at two months: around 2,000 visits, consistent pickup in AI answers, and demos coming from it
- Kill switch: under 500 visits, zero AI pickup or no sales engagement after four weeks
The kill threshold is the part founders skip. Without it, every experiment becomes "promising, needs more time," and the quarter fills up with experiments nobody is willing to end.
When does ICE start earning its place?
When you have scale: enough ideas that you can't hold them in your head, people to implement them beyond yourself, and stakeholders who care what gets shipped when.
That last one is the real trigger. Once a board asks what's next, a sales team is waiting on comparison pages and a product lead is protecting roadmap capacity, a shared scoring method stops being overhead. It becomes the thing that ends arguments. For most founders, that point arrives around the time they hire their first marketer. Until then, two lanes and a kill switch will do more for you than a sorted spreadsheet.
FAQ
Is ICE or RICE better?
Neither is better in general. RICE is better when you can estimate reach from product data and you're prioritizing features. ICE is better for fast, small growth experiments. Before you have either kind of data, a short list with success and kill thresholds beats both.
Should you average, multiply or weight ICE scores?
Multiply, and weight through the scales. Multiplying lets one weak score pull an idea down. Giving Ease a narrower scale (1–5) stops easy ideas from winning by default.
How do you make ICE scores less subjective?
Measure Impact in one real unit (euros of pipeline, sessions or users affected), anchor every scale with written definitions – Confidence 10 means you ran something very similar and it hit the projected impact – and measure Ease in person-days plus who's needed.
Should marketing and product experiments be scored together?
No. In one list, either marketing wins on Ease and product-side bets never get picked, or the product-side bets win and wait in the engineering queue. Rank them in separate lanes with separate capacity.
What's a kill switch in a growth experiment?
A threshold, set before the experiment starts, that tells you to stop. For example: "under 500 visits after four weeks, we end it." It keeps experiments from drifting on as "promising" forever.
How many experiments should an early-stage startup run at once?
For a founder-led team, three or four: two or three quick experiments that answer in weeks, plus one long bet that compounds over months.
None of this makes experiments win more often. Most will lose – that's why you test instead of shipping your favorite idea. What it changes is how much each loss teaches you and how quickly you stop paying for the ones that aren't working.
If you're a founder looking at a 40-row idea list with nobody to run it, building that first 90-day experiment roadmap – and running it with you – is a big part of what I do. Book a free call and bring the list.